Operational risk teams rely on two cornerstone tools to keep processes safe and compliant: Risk and Control Self-Assessment (RCSA) and Key Risk Indicators (KRIs). Together, they identify where things can go wrong, evaluate whether controls are working, and track early warning signals against clear risk appetite thresholds. The result is sharper visibility, faster escalation, and better alignment of business decisions with resilience goals.
RCSA process
- Scope and map processes, products, and key services; define objectives and material risks for each unit or process.
- Identify and document controls (preventive, detective, corrective) and link them to specific risks and control owners.
- Assess inherent risk using calibrated likelihood and impact scales and clear criteria for financial, customer, conduct, regulatory, and operational impact.
- Test control design and operating effectiveness using walkthroughs, sampling, thematic reviews, and issue validation; record gaps and action plans.
- Rate residual risk post-controls; compare to risk appetite and record risk acceptance, remediation, or compensating controls; track to closure with due dates.
Defining inherent risk
- Inherent risk is the exposure before considering controls; it reflects the risk embedded in the activity, complexity, volumes, change level, and external environment.
- Use a consistent scale (e.g., 1–5 for likelihood and 1–5 for impact) and document objective criteria and examples to reduce score subjectivity.
- Consider amplifiers such as third-party dependence, technology stack fragility, concentration, and regulatory sensitivity when setting inherent ratings.
Study of effectiveness of control
- Design effectiveness: Does the control, as designed, address the stated risk cause and pathway? Are roles, frequency, evidence, and thresholds defined?
- Operating effectiveness: Is the control performed as intended, with timely evidence and exceptions handled correctly?
- Evidence: Maintain artifacts (logs, approvals, reconciliations) and define sampling strategies; capture test results, exceptions, and remediation status.
- Segregation: Ensure independence where required (e.g., reconciliations, approvals); flag key controls that anchor the risk to prioritize testing cadence.
Computation of risk zone
- Compute residual risk via a matrix or formula (e.g., residual = inherent × control effectiveness modifier), then place outcomes on a heat map.
- Define “risk zones” (e.g., green/amber/red) by combining residual rating, velocity, and susceptibility to accumulation or correlated failures.
- Use risk zones to prioritize actions, increase testing frequency, and set escalation pathways to senior management and risk committees.
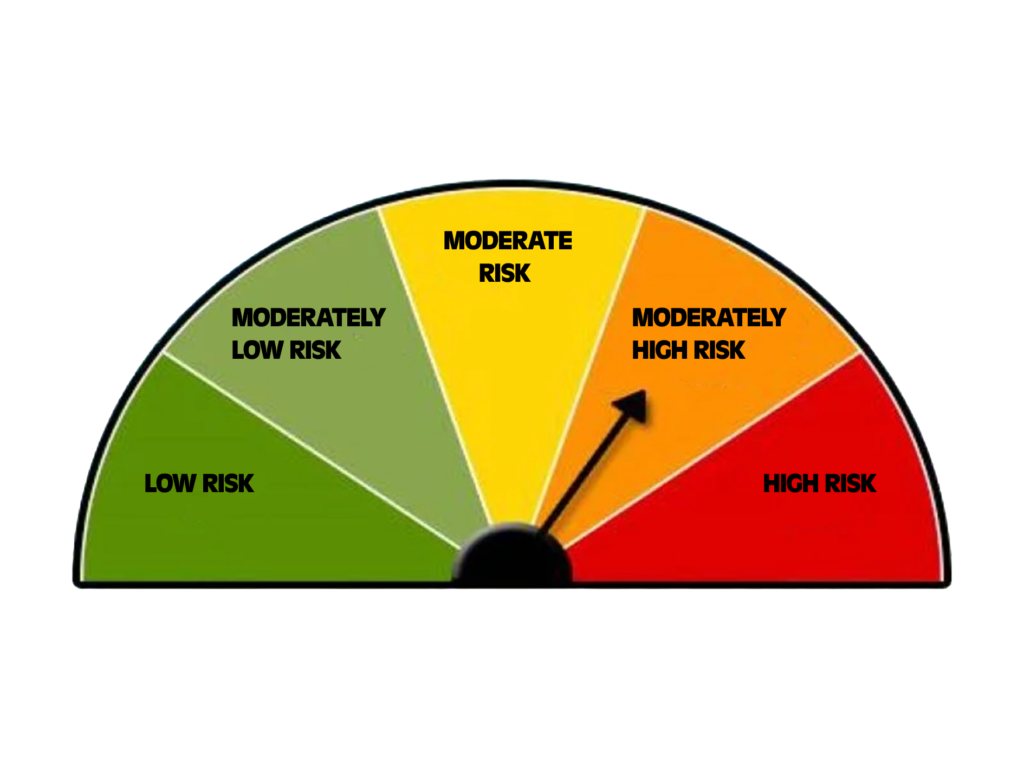
Color coded risk levels
- Apply a simple, consistent scheme:
- Green: within appetite; monitor via KRIs and standard controls.
- Amber: at appetite boundary; execute remediation with target dates and interim safeguards.
- Red: outside appetite; immediate escalation, temporary risk reduction actions, and management attention.
- Publish a legend and criteria for each color to avoid inconsistent classification across units.
Key Risk Indicators (KRIs)
- KRIs are quantifiable measures that signal changes in risk exposure or control performance ahead of losses.
- Types:
- Leading: control execution timeliness, patching backlog, model exceptions, change failure rate.
- Coincident: break rates, near-miss counts, fraud alerts per 1,000 transactions.
- Lagging: confirmed incidents, regulatory findings, customer detriment payouts.
- Design KRIs to be specific, attributable, timely, and repeatable; link each KRI to a risk, control, owner, data source, and reporting frequency.
Various forms of KRI
- Volume/throughput adjusted metrics (per transaction, per million messages, per FTE).
- Quality/error measures (straight-through-processing rate, reconciliation breaks, exception aging).
- Timeliness measures (SLA adherence, cycle time variation, backlog days).
- Control health measures (testing pass rate, overdue issues, entitlement recertification timeliness).
- Resilience metrics (RTO/RPO adherence, critical service availability, dependency concentration).
Selecting KRIs
- Start from the risk taxonomy and RCSA outputs; select indicators that track the main causes and controls for top risks.
- Apply selection filters: materiality, sensitivity to change, data reliability, actionability, and cost of measurement.
- Limit to a focused set per risk (e.g., 3–5 KRIs) to drive management action; avoid vanity metrics.
- Define thresholds: trigger, limit, and hard stop; calibrate using history, external benchmarks, and scenario results; review at least annually.
Risk appetite
- Translate board-approved appetite into measurable limits for residual risk and KRIs (e.g., break rates, outage minutes, complaint volumes).
- Cascade appetite by business line and critical process; define breach protocols, temporary tolerances, and approval authorities.
- Align performance incentives to respect appetite; link persistent amber/red to remediation milestones and governance consequences.
Scenario analysis
- Use structured scenarios to test severe but plausible events (e.g., cyber service outage, payment failure, conduct mass redress).
- Calibrate scenarios using internal losses, near-misses, KRIs at stress, external events, and expert workshops.
- Derive implications for capital, liquidity, resilience investment, and KRI threshold resetting; incorporate “reverse” scenarios to test appetite boundaries.
Uses of KRIs
- Early warning and escalation: color thresholds tied to playbooks for swift response.
- Performance and capacity management: identify bottlenecks and failure points before service impact.
- Control prioritization: steer testing and remediation to where indicators deteriorate.
- Scenario calibration: translate indicator stress paths into impact estimates.
- Board and regulator reporting: demonstrate proactive monitoring and alignment to appetite.
Operational Risk Articles related to Model ‘D’ of CAIIB –Elective paper: